
Working capital is an integral part of trade finance.
The flow of capital worldwide partly depends on the amount of capital that corporations have on hand, and can be deployed for various things, like trade finance or supply chain finance (SCF).
For over 10 years, J. P. Morgan has kept track of working capital, known as the Working Capital Index (WCI), giving the industry and broader financial markets a series of benchmarks.
Now, we have to put this data in context: These reports are based on the S&P 1500, with some exclusions (with similar metrics used for China and other regions), and this is based on 2023 figures, as that’s the last full year with trade finance metrics that can be analyzed, so it’s not a real-time global dashboard of the flow of corporate capital.
However, it is useful to assess where and how working capital is flowing, and consider how this impacts the trade finance market.
To start with, we need to put the WCI in the context of current trade finance headwinds, none of which could be reasonably predicted when J. P. Morgan published the 2024 WCI report.
Current trade finance headwinds (in context)
Unlike the profound shocks that hit every market in April, trade and trade finance have calmed down, for now.
Following the turbulence of “Liberation Day” and a rapidly escalating trade war, Goldman Sachs “raised the odds of a U.S. recession to 45% from 35%, the second time it has increased its forecast in a week.”
It took massive sell-offs in the $28 trillion U.S. Treasury Bonds market before Trump de-escalated the trade war.
The latest predictions come from J.P. Morgan Research says that an: “Aggressive tariff policy could push the U.S. — and possibly the global economy — into recession this year.”
More recently, the World Trade Organization (WTO), “now anticipates a decline between 0.2% and 1.5% in global merchandise trade for 2025, depending on the extent of the applied tariff measures.”
This is “An unprecedented setback”, however; as Societe Generale Trade Services notes: “We observe that our clients have not, for the moment, cancelled their existing contracts or the mandates they entrusted to us for the issuance of Trade Finance instruments (letters of credit, SBLCs, guarantees, short-term financing).”
We also need to remember that we’ve seen a variation of this chaos before.
Between 2017 and 2023, during Trump’s first round of tariffs and trade wars (a period that included the Covid-19 pandemic; incredibly disruptive for trade, in the short-term), the impact wasn’t as great as you might imagine.
As Allianz Global Investors uncovered: “A closer examination of broader data suggests Mr. Trump’s tariffs may have disrupted global trade only marginally.”
As the data proves:
- Supply trade finance grew at a CAGR of 26% from 2017 to 2023 despite an increase in global protectionism and tariffs.
- Factoring finance ⏤ mainly used by small businesses and mid-market companies to raise finance against their invoices payable ⏤ still grew at a rate of 5%, despite the same headwinds and uncertainty.
This is why we’re fairly confident that even with new tariffs, trade finance won’t be dramatically impacted, and growth in this market is set to continue.
With the above in mind, let’s take a closer look at the most recent Working Capital Index (WCI), and what this means for trade finance.
Working Capital Index (WCI) Key Data Points
The highlights are that: “Lower cash levels were seen across multiple sectors, with an increase in cash conversion cycle of 2.4 days.”
“Factors such as reshoring of supply chains, elections across 77 countries, the high cost of COVID debt refinancing, sustainability pressures and the rise in AI investments may continue to impact working capital management in 2024.”
Worldwide Macro Trends
- Near 10-year highs
S&P 1500 companies reported near-record working capital levels, with about $707 billion of trapped liquidity, up 40% from pre-pandemic levels.
- Demand/supply driving change
Large working capital movements across sectors include significant increases in inventory levels in the semiconductor and pharmaceutical industries, increases in DSO for oil & gas, and more.
- Cash conversion cycle up
67% of S&P 1500 companies reported longer days sales outstanding (DSO) and 76% saw increased days inventory outstanding (DIO).
- Lower cash levels
There has been a marginal reduction in cash levels from 2022 across multiple sectors, with 64% of S&P 1500 companies reporting increased capital expenditures.
- Working Capital Forecast remains challenging
Treasury teams will likely continue to navigate multiple headwinds that may impact working capital management in 2024, including sustainability pressures, reshoring supply chains, increased investment in AI, and more.
Note on JP Morgan data: A total of 964 businesses out of the S&P 1500 were included in the data analysis (excluding financial services, real estate firms, those with high volatility, or ones with incomplete data).
All numbered data have been gathered from Capital IQ for the purpose of calculations. The trends extracted from our analysis were validated against insights from J.P. Morgan’s research team.
Data is based on 2023 figures, as that’s the last full year with trade finance metrics that can be analyzed, so far.

Because 2023 is the last full year with trade finance metrics that can be analyzed, we are taking the JP Morgan findings with an interpretation based on what’s happening in 2025, rather than how these figures were understood in 2024.
Explaining An Evolving Working Capital Environment: Worldwide & China
Working finance is evolving. The good news is that the amount of working capital is increasing.
However, there are a lot of headwinds and pressures on working capital and trade finance to think about.
The following tables, and the analysis of what’s happening in China, unpack some of the trends outlined above.
Table 1: Working Capital Index, 2011-2023
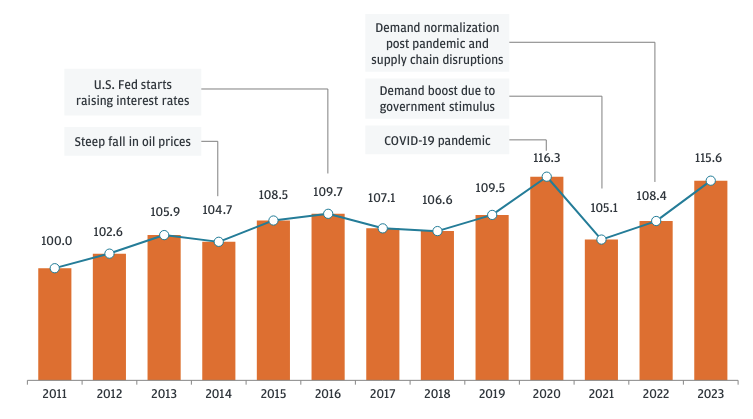
(Source: All years have been indexed based on 2011 figures as the benchmark).
Explaining the table above: “In the current higher interest rate environment, the increased carrying cost of funds tied up in working capital underscores the urgency for treasurers and CFOs to adopt a proactive stance.”
“Collaboration with internal and external stakeholders, including procurement, business units, operations and financial institutions, will be essential in optimizing working capital management across the balance sheet.”
To explain this further, here is how cash flow cycles actually work (Table 2, CCC), and how companies and banks can improve cash conversion cycles (Table 3).
Table 2: How the Cash Conversion Cycle (CCC) Works
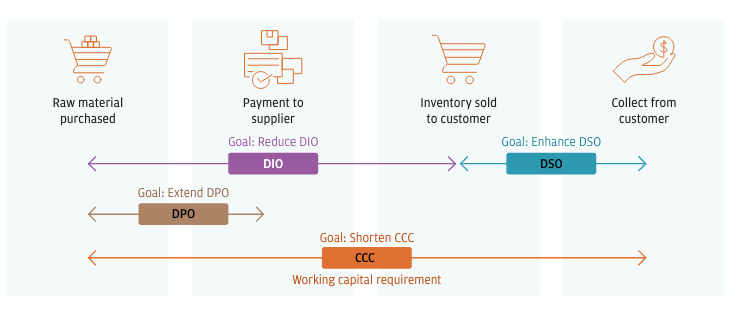
Explaining the table above: The cash conversion cycle (CCC) is the number of days it takes to convert inventory purchases into cash flows from sales (source):
- The CCC helps quantify the working capital efficiency of a company and is derived from three components:
- Days sales outstanding (DSO) or the number of days taken to collect cash from customers.
- Days inventory outstanding (DIO) or the number of days the company holds its inventory before selling it.
- Days payable outstanding (DPO) or the number of days from the time a company procures raw materials to the payment of suppliers
Every area of working capital could benefit from trade finance in some way; that’s why banks and asset managers are keen to expand trade finance operations, including distribution.
Table 3: How to improve working capital efficiency
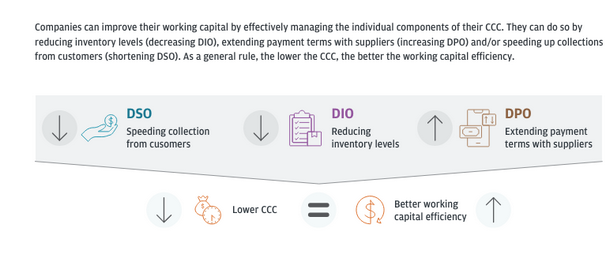
Explaining the table above: Companies can improve their working capital by effectively managing the individual components of their CCC.
They can do so by reducing inventory levels (decreasing DIO), extending payment terms with suppliers (increasing DPO), and/or speeding up collections from customers (shortening DSO). As a general rule, the lower the CCC, the better the working capital efficiency (source).
With that in mind, and thinking about the impact of trade wars on various sectors, these are the industries that are more vulnerable to supply chain disruptions.
Table 4: Industries with higher global dependence are far more vulnerable to supply chain disruptions
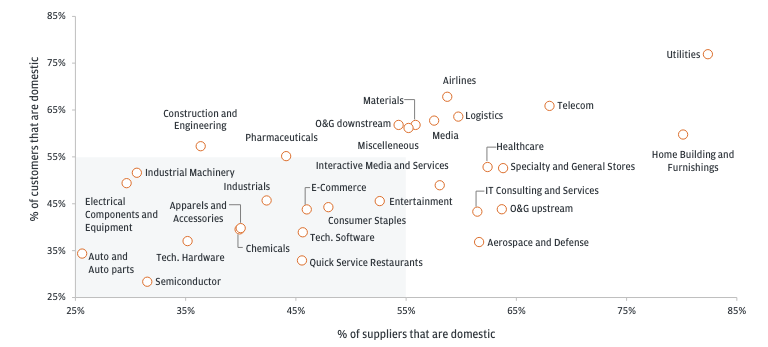
Explaining the table above: Industries today are globally interconnected, where an incident that occurs in one part of the world will have ripple effects on another.
The dynamics between suppliers and customers play a pivotal role in shaping and understanding industry segments.
Industries with a higher percentage of international suppliers and customers (such as those in the highlighted box in the chart above, bottom left) must be more cautious and vigilant in managing their supply chains, especially amid increased global uncertainties.
These industries must adopt sound risk management strategies to mitigate supply chain vulnerabilities. They must also ensure they have robust business continuity plans in place to improve resiliency (source).
China Working Capital Index (2024)
China’s WCI was more encouraging than previous years, as of 2023:
- 53% of Chinese companies saw an improvement in their cash
- conversion cycle (CCC), of which 77% registered an increase in days payable outstanding (DPO) and 64% witnessed lower days inventory outstanding (DIO)
- CCC performance improved by 1.6 days;
- Cash levels dropped by 8.9%
- 61% of all companies noted a lengthening in DPO
- 63% of all companies saw deterioration in days sales outstanding (DSO)
Compared to the S&P 1500: CCC is 1.2 days longer; Cash levels are 20% higher
With CCC improvements, an incredible $321 billion of operating liquidity could be unlocked for Chinese companies
Here is what J. P. Morgan has found about China’s WCI:
- Gradual consumption recovery
Post-reopening (after Covid-19), the economic recovery path was bumpy and uneven, with supportive policies introduced to propel growth in targeted industries.
- Weaker Yuan and increased cash outflow
The U.S. dollar strengthened against the Chinese yuan, with the greater interest rate differential between the U.S. and China resulting in rising cash outflows to offshore investment and trading opportunities.
- Globalization strategy challenges
Chinese companies pursuing international diversification have been hit by a tightening of trade barriers in certain sectors, as well as stricter regulations for foreign products, combined with management challenges and higher capital and operating costs.
- Growing lending gap
Financial institutions’ appetite for risk decreased, widening the gap between large and small corporations’ access to credit and financing.
- Ongoing geopolitical uncertainties
Armed conflict, disrupted trade routes, and instability from global elections added more complexity to supply chains and trade networks around the world.
Note on data from China: Working Capital Index constituent selection: China CSI300 + HSCEI 50 + S&P US China 50; 400 companies in total, and 276, respectively.
As per the Global WCI, Chinese companies also exclude the Real Estate and Financial Services sectors. All numbered data have been gathered from CapitalIQ for calculations. The trends extracted from our analysis were validated against insights from J.P. Morgan’s research team. All the currency is USD-based.

Key Takeaways: Working Capital in 2025 and Beyond
This report is showing lots of encouraging signs, or at least it was, as of the end of 2023:
- Working capital cash flows were up: With about $707 billion of trapped liquidity, up 40% from pre-pandemic levels.
- Cash levels were only down marginally.
- Even the Chinese WCI was showing a healthy rebound from the pandemic days.
As we have seen since, world trade and finance have taken a hit, but not a fatal one. The global economy and financial institutions seem to have factored future disruption into the market, and for now, it’s business as usual.
It’s also worth remembering that we’ve worked through similar shocks in the past and the market is more resilient and robust than it appears on the surface.
Here’s another great reason to work with us! In December 2024, Global Business & Finance Magazine awarded LiquidX with three awards for the second year in a row:
- Best Digital Solutions For Global Trade, United States 2025
- Best Technology Vendor Of The Year, United States 2025
- Best Fintech For Trade, United States 2025
Banks and asset managers: To request a demo of our trade finance distribution solutions, click here.